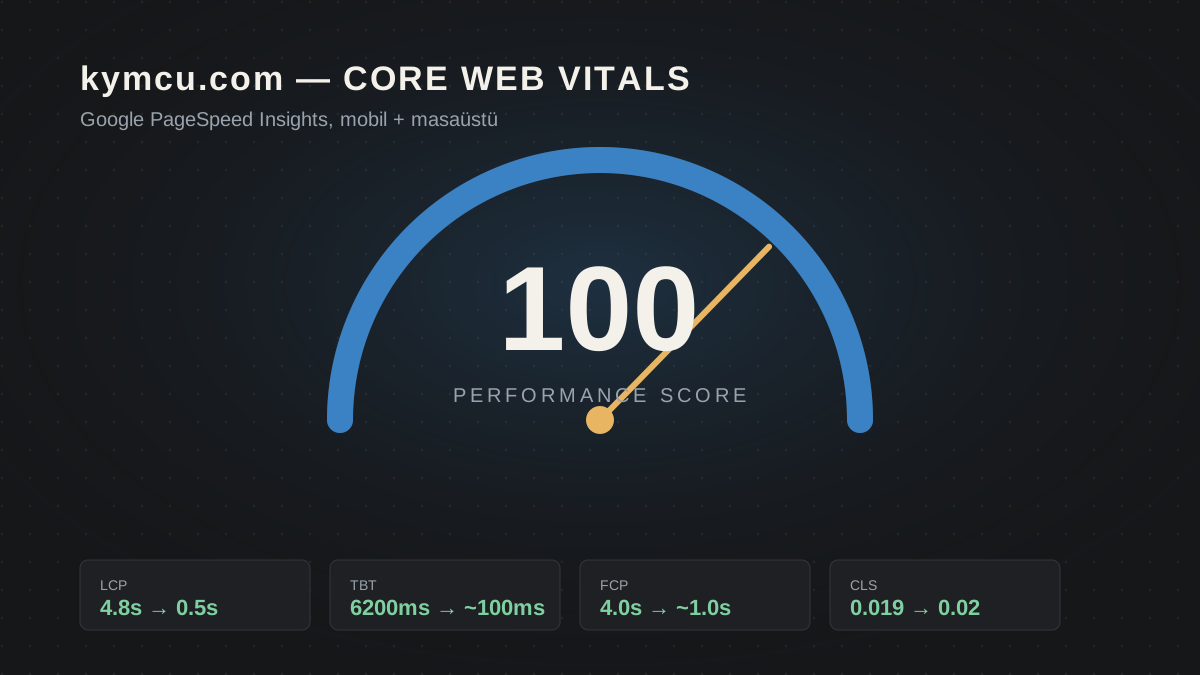
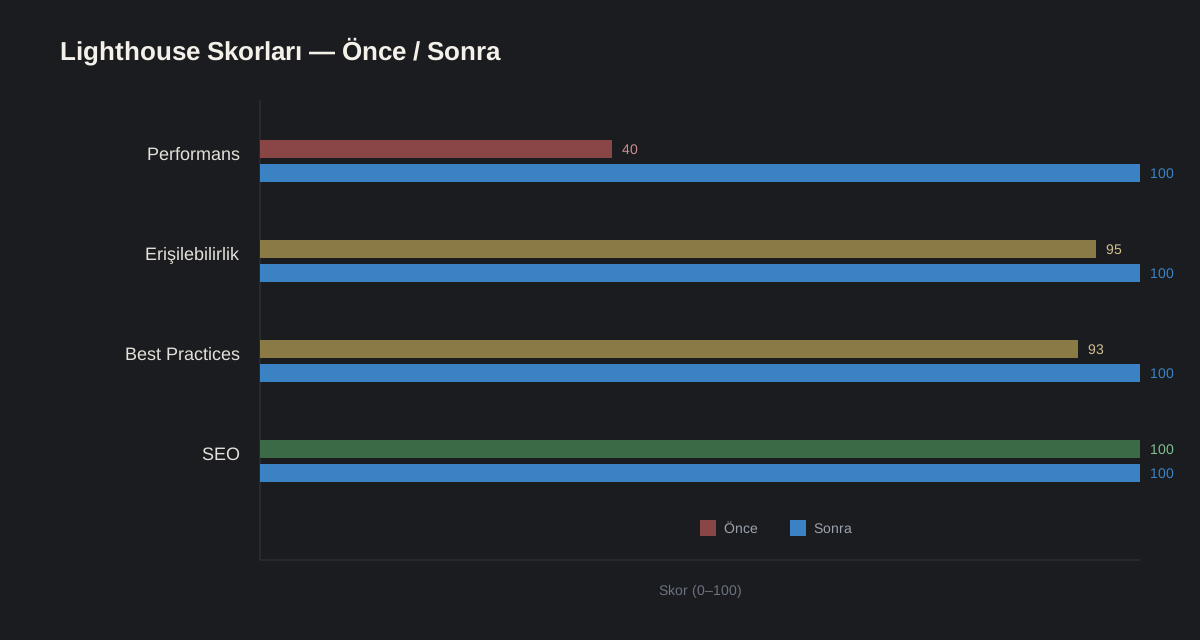
This site's — kymcu.com's — mobile PageSpeed Insights performance score was 40 at one point. Accessibility sat at 95, best practices at 93 — not terrible, not great either. Today all four are 100.
This isn't a "10 tips" listicle. It's a record of a real case: the fixes we made, in order, on our own site — which metric dropped and why, which fix actually mattered, and which one looked reasonable but did nothing.
Scores and metrics
| Metric | Before | After |
|---|---|---|
| Performance | 40 | 100 |
| Accessibility | 95 | 100 |
| Best Practices | 93 | 100 |
| SEO | 100 | 100 |
| LCP | 4.8s | ~0.5s |
| TBT | 6,200ms | 0–200ms |
| FCP | 4.0s | ~0.4–2.7s |
| CLS | 0.019 | 0–0.043 |
100/100/100/100 on both mobile and desktop scans — verified against the real Google PSI server, screenshots on file.
The real bottleneck: the font CDN
The single biggest LCP win came from an unexpected place. Fonts pulled from the Google Fonts CDN were blocking the page's large heading (the LCP element) — DNS resolution, TLS handshake, an extra round trip. Even non-blocking loading tricks like preload + media="print" couldn't eliminate that cost entirely.
The fix was blunt but decisive: we downloaded Bebas Neue, Manrope (variable, all weights in one file) and JetBrains Mono (variable) with latin + latin-ext subsets and started serving them ourselves from public/assets/fonts/. The latin-ext subset is non-negotiable for Turkish characters (ı, ş, ğ) — ship latin only and headings render broken.
We preloaded the six critical font files with <link rel="preload" as="font"> in <head> and removed fonts.googleapis.com / fonts.gstatic.com from the CSP. Result: the "element render delay" in the LCP breakdown vanished completely.
A hidden bug: elements were animating twice
Code review turned up something interesting: the scroll-reveal script was processing the same elements in both a single loop and a group (data-stagger) loop — twice. Service rows and blog cards were double-triggering their reveal animation. Visually invisible, but it was loading unnecessary work onto the main thread.
That's a trap of the "solve everything with a library" approach: GSAP ScrollTrigger's own scroll-polling cost kept the main thread busy continuously, showing up in Total Blocking Time as "long tasks." The fix was to remove ScrollTrigger entirely and move scroll-reveal logic to a native IntersectionObserver + CSS transition. We deleted the library outright — the file is gone from both the repo and the server.
Splitting tasks for TBT
The JS boot sequences that ran on page load — cursor tracking, hover effects, the particle canvas, the skyline reveal — ran as one large task. Lighthouse counts every task over 50ms toward TBT, so we split them into separate frames using chained requestAnimationFrame calls instead of one big task. Nothing non-critical blocks the first frame anymore.
Contrast fixes (WCAG AA)
What took the accessibility score from 95 to 100 was contrast ratios: the primary button background got slightly darker (contrast 3.75 → 5.44), and the marquee text color in the hero and footer was updated (2.97 → 4.71). Bonus find: a forgotten @import url(fonts.googleapis...) line at the top of the CSS file was silently undoing our font self-hosting work — deleting it, the difference was immediate.
Something we deliberately didn't do: inline critical CSS
The way to zero out the render-blocking CSS warning entirely (an already-unscored, 150ms warning) was to inline critical CSS into <head>. We deliberately didn't — on a multi-page site, that breaks CSS being shared across pages in the browser cache. Trading a real performance advantage for an unscored warning didn't make sense.
Takeaways
- The biggest win usually comes from where you least expect it. Here, a third-party font CDN was a far bigger cost than assumed.
- Libraries aren't free. ScrollTrigger's own overhead wasn't worth the complexity of the problem it solved (simple scroll-reveal).
- Local measurement is noisy. Consecutive scans on the same machine bounced between 29 and 42 — the real number is always the scan from Google's actual PSI server.
- Contrast is often most of the accessibility score. Two color changes took 95 to 100.
A PageSpeed 100 isn't the goal — it's a symptom. Every fix here also means a real user sees the page faster, downloads less data, and drains less battery. If you want a similar improvement on your own site, get in touch — we'll run this same process on your stack.